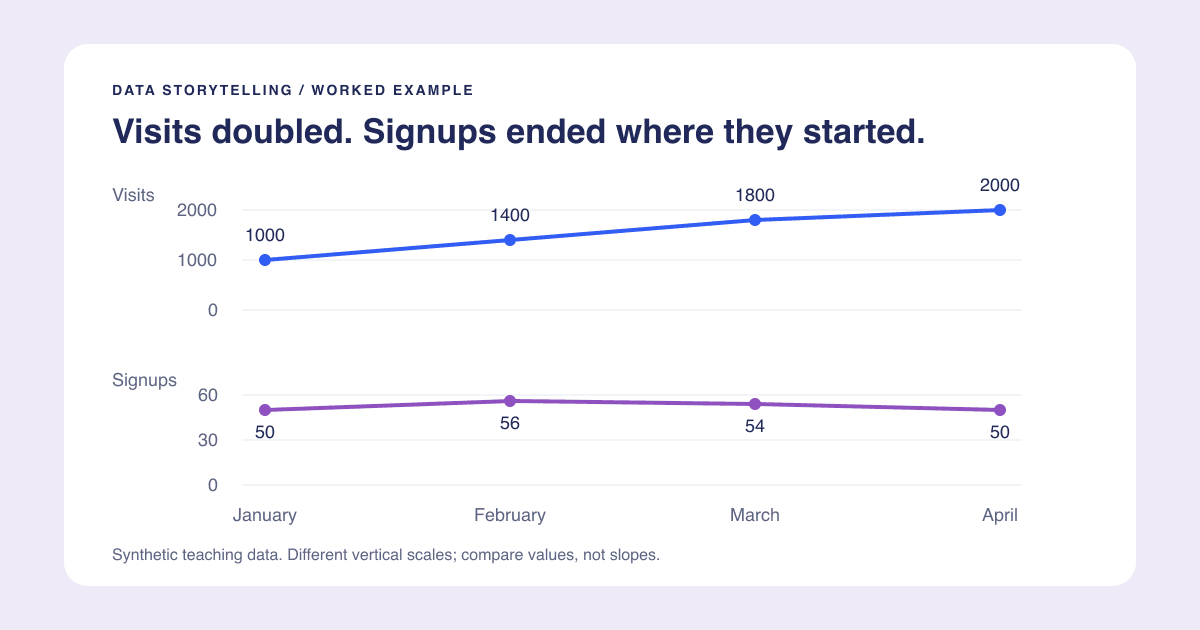
A useful chart title tells the reader what they are looking at or what the evidence shows. The best choice depends on the job: a lookup table needs a clear subject; a presentation often benefits from a clear takeaway.
Write the title after checking the values, units, denominator, and period. If you cannot support the sentence from the chart and its source, soften it or change the chart. Do not use a confident title to hide an uncertain analysis.
Choose one of three title types
Descriptive titles name the measure and context. "Completed signups by month, January-April" helps readers navigate a recurring report. It does not tell them what to conclude.
Takeaway titles state a supported finding. "Visits doubled, but monthly signups stayed flat" is useful when presenting the specific comparison in our worked storytelling example.
Question titles frame an exploration. "Did more visits lead to more signups?" is appropriate before the analysis. If the slide answers the question, consider putting the answer in the final title rather than making the audience solve it again.
None is universally best. A dashboard used for repeated lookup may need stable descriptive headings even when a one-off slide needs an assertion.
Eight before-and-after examples
These examples use invented data or explicitly conditional situations, not customer outcomes.
| Weak or risky title | Better title | What to check |
|---|---|---|
| Website performance | Visits doubled, but monthly signups stayed flat | January has 1000 visits and 50 signups; April has 2000 and 50 |
| Conversion crashed | Signup rate fell from 5.0% to 2.5% | Same visits-based denominator in both months |
| Most students prefer notes | Lecture notes were the most-used resource | 42 of 100 chose notes; that is not a majority or necessarily a preference |
| Office hours do not work | Office hours received 12 of 100 responses | Usage counts do not measure learning effectiveness |
| Revenue by region | West recorded the highest revenue this quarter | Same currency, period, and included regions |
| Our campaign caused growth | Signups increased after the campaign launched | Timing alone does not establish causation |
| Satisfaction improved 20% | Satisfaction rose from 60% to 72% | This is 12 percentage points, or 20% relative growth |
| The forecast proves demand | Forecast shows growth under the stated assumptions | A forecast is not an observed outcome |
The first four rows come from the downloadable traffic and survey examples. The remaining rows illustrate wording; they are not additional measured datasets.
Put detail in a subtitle
Do not cram the entire methodology into one headline. Use a compact hierarchy:
- Title: Visits doubled, but monthly signups stayed flat.
- Subtitle: January-April; completed signups and website visits.
- Definition note: Rate equals completed signups divided by visits, not unique visitors.
- Source note: Illustrative dataset created for this guide.
For a real report, replace the last line with the actual source, extraction date, and material exclusions. Keep those notes with the chart when exporting. A chart detached from its denominator or period can become misleading even when the bars are accurate.
Audit numerical language
Check "more," "most," "majority," "average," and "growth." Each implies something specific. The largest of four groups can contain less than half the population. A higher total can come from more observations rather than a higher per-person result. An average can hide a skewed distribution.
For rates, write out the calculation. Moving from 60% to 72% is 72 - 60 = 12 percentage points. Relative growth is (72 - 60) / 60 = 20%. If the initial value is zero, the usual relative-change formula is undefined; describe the absolute change instead of inventing a percentage.
If results are sampled or estimated, include the relevant uncertainty rather than rounding a tiny difference into a decisive winner. If your dataset cannot establish a cause, use observational language such as "increased after" instead of "increased because of."
Use a reusable title template
Try: [Measure or group] + [observed pattern] + [comparison or period].
For example: "Completed signups stayed at 50 while visits doubled, January to April." If that is too long, keep the main finding in the title and move the period to a subtitle. Avoid arbitrary character limits: test wrapping and readability at the actual final size.
Read the title aloud without pointing at the chart. Then cover it and ask whether the chart itself supports the same claim. Both should tell the same story. Continue with the chart design checklist to remove visual distractions, or the presentation guide to fit the title and evidence on a slide.