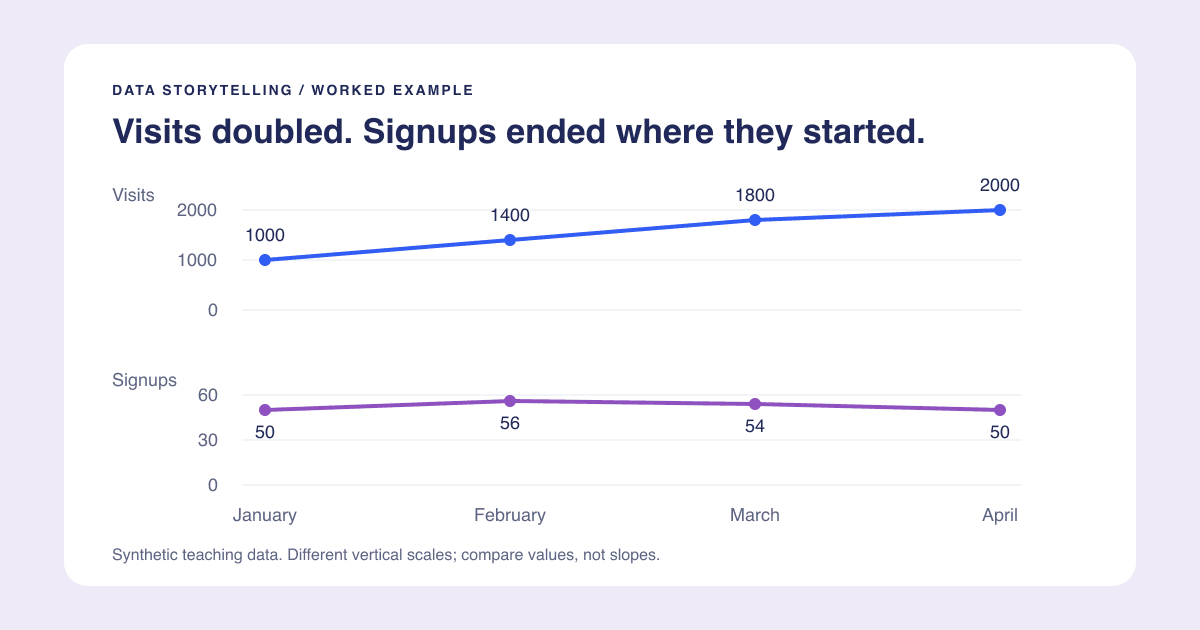
Data storytelling means helping a particular reader understand what happened, why it matters, and what to investigate or do next. It does not mean adding a confident narrative to uncertain numbers.
Here is a worked example using invented website data. These are not PlotsAlot traffic or conversion figures. The downloadable CSV contains every input, so you can reproduce the calculations without an account.
Define the reader and the decision
Imagine a small team deciding whether more website traffic is producing more signups. The team needs a conversion view, not just a screenshot of a rising visits chart.
| Month | Visits | Completed signups | Signups divided by visits |
|---|---|---|---|
| January | 1000 | 50 | 5.0% |
| February | 1400 | 56 | 4.0% |
| March | 1800 | 54 | 3.0% |
| April | 2000 | 50 | 2.5% |
The denominator matters. This example uses visits, not unique people. If one person visits twice, they can contribute two visits. In a real analysis, confirm that the signup count and traffic denominator cover the same period and population, and that tracking definitions did not change.
Calculate before writing the headline
Visits doubled from January to April: (2000 - 1000) / 1000 = 100%. Completed signups ended where they began, at 50. The visits-based signup rate fell from 5.0% to 2.5%.
That decline is 2.5 percentage points, or 50% relative to the January rate. Those are different descriptions of the same change, not interchangeable units. Reporting a "2.5% decline" would be ambiguous here.
The data supports this takeaway: "Visits doubled, but monthly signups stayed flat." It does not support "Our new campaign brought low-quality visitors." There is no campaign, device, or source breakdown in these four rows.
Choose a chart that makes the claim inspectable
A visits line alone would tell only half the story. Putting visits and signups on a single shared scale would make the signup line nearly flat at the bottom. A dual axis could emphasize almost any visual relationship depending on the scales you choose.
For a short presentation, use two aligned panels: visits above, completed signups below, with the same month order and a clearly labeled scale in each. Add the rate calculation as a small table or separate annotation. Readers can see the traffic growth and verify that signups did not grow with it.
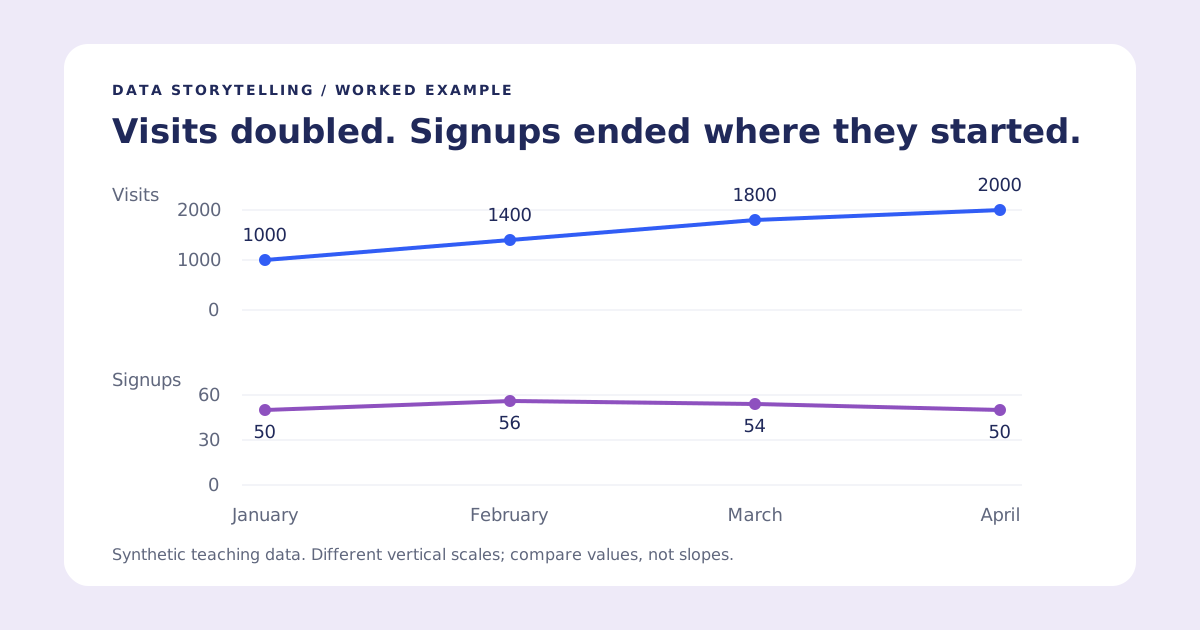
Two aligned line charts show visits rising from 1000 to 2000 while completed signups move from 50 to 56 to 54 to 50. The complete data is in the table above.
These panels do not share a vertical scale, so compare the values and directions, not the slopes' apparent steepness. If the only question is signup-rate change, a single rate chart may be the more direct choice. Our line-chart guide covers time-series basics.
Add context without inventing a cause
A useful narrative has three parts:
- Observation: visits doubled between January and April; signups did not increase.
- Implication: growing traffic alone did not increase monthly signup volume in this example.
- Next check: inspect comparable source and landing-page cohorts before changing acquisition spend.
That final step is a proposed investigation, not a finding. Alternative explanations include a source-mix shift, a broken form, measurement changes, repeated visits, or ordinary variation. With four aggregate rows, you cannot distinguish them.
If an event genuinely occurred, annotate its date and identify the source of that information. Do not place "new campaign launched" on a chart simply because a line changed direction there.
Write a title that survives scrutiny
"Website performance" names a topic but says little. "Traffic growth failed" overreaches. "Visits doubled, but monthly signups stayed flat" is specific and testable against the table.
A subtitle can carry "Illustrative data, January-April; rate uses visits, not unique visitors." Keep the source and definitions with the chart when you export it. For more patterns, see chart title examples.
Finish with a question worth answering
Before presenting, ask whether the reader can explain the takeaway and name what remains unknown. If they remember only a dramatic upward line, the communication has failed even if the chart looks polished.
To practice, upload the synthetic CSV to the line graph generator and request separate visits and signup charts. Check its calculations against the table. Account-based AI generations have an allowance; the example data and this guide are freely available. Then follow the presentation workflow to keep the evidence readable outside the editor.