Leveraging AI for Sociology Research
Sociological research lives and dies by data. Researchers need to analyze large datasets to understand human behavior, social interactions, and cultural phenomena. The problem? Traditional analysis is time-consuming and often requires specialized technical skills.
PlotsALot changes this equation. Our AI-driven tool lets sociologists analyze complex social data without getting bogged down in technical details.
Analyzing Social Survey Data
Let's look at a practical example using General Social Survey (GSS) data. This dataset collects information on contemporary American society, tracking attitudes, behaviors, and attributes over time.
Step 1: Understand your data
Before any analysis, get a clear picture of what you're working with. With PlotsALot, you'd simply ask:
"Give me an overview of the GSS dataset structure and show me the first few rows of data"
See Your Data in Action
Ready to visualize your own data? Try our AI-powered analysis tool and transform your data into beautiful insights.
PlotsALot immediately displays key information like number of observations, variable types, and sample data - no coding required.
Step 2: Analyze ballot usage over time
Want to understand survey methodology evolution? Just ask:
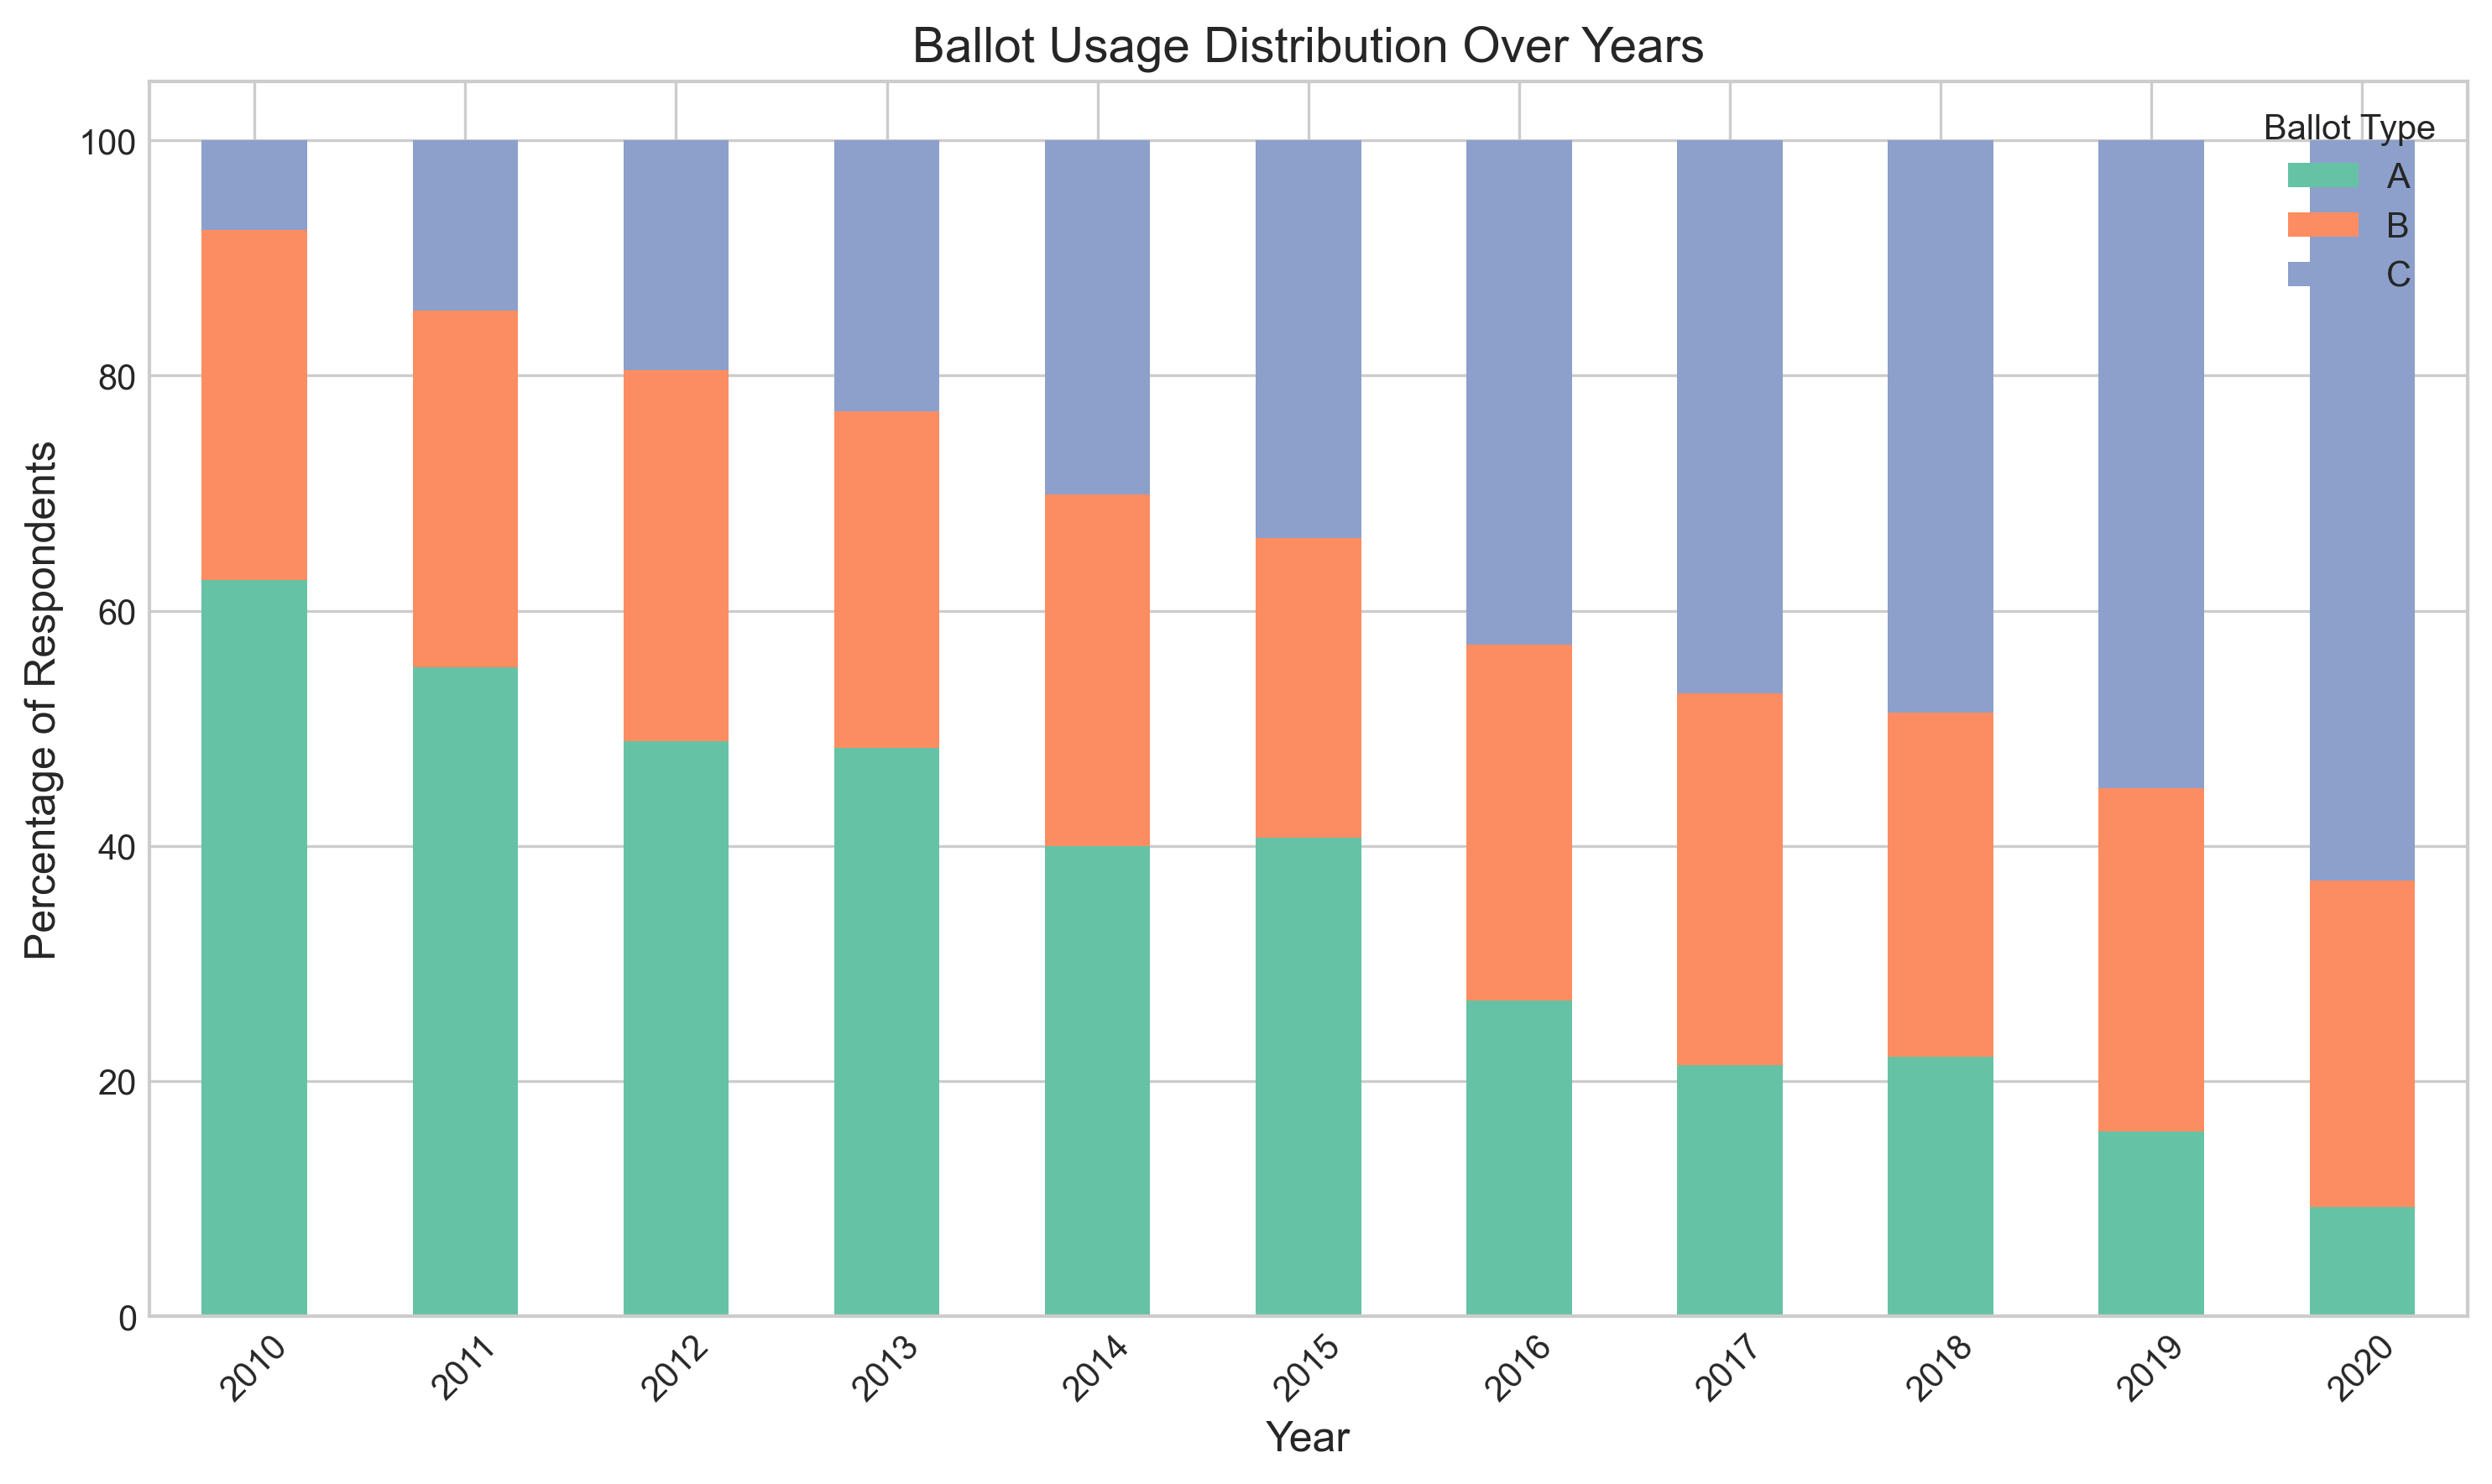
"Show me how ballot usage patterns have changed over the years in the GSS data"
PlotsALot automatically generates both tabular data and visualizations showing how different ballot types were deployed over time.
Ballot usage distribution over years
Step 3: Identify trends in survey responses
Track how response patterns have changed over time by asking:
"Visualize the number of survey responses per year in the GSS data as a line chart"
PlotsALot instantly creates a trend line showing response volume changes, highlighting any significant patterns.
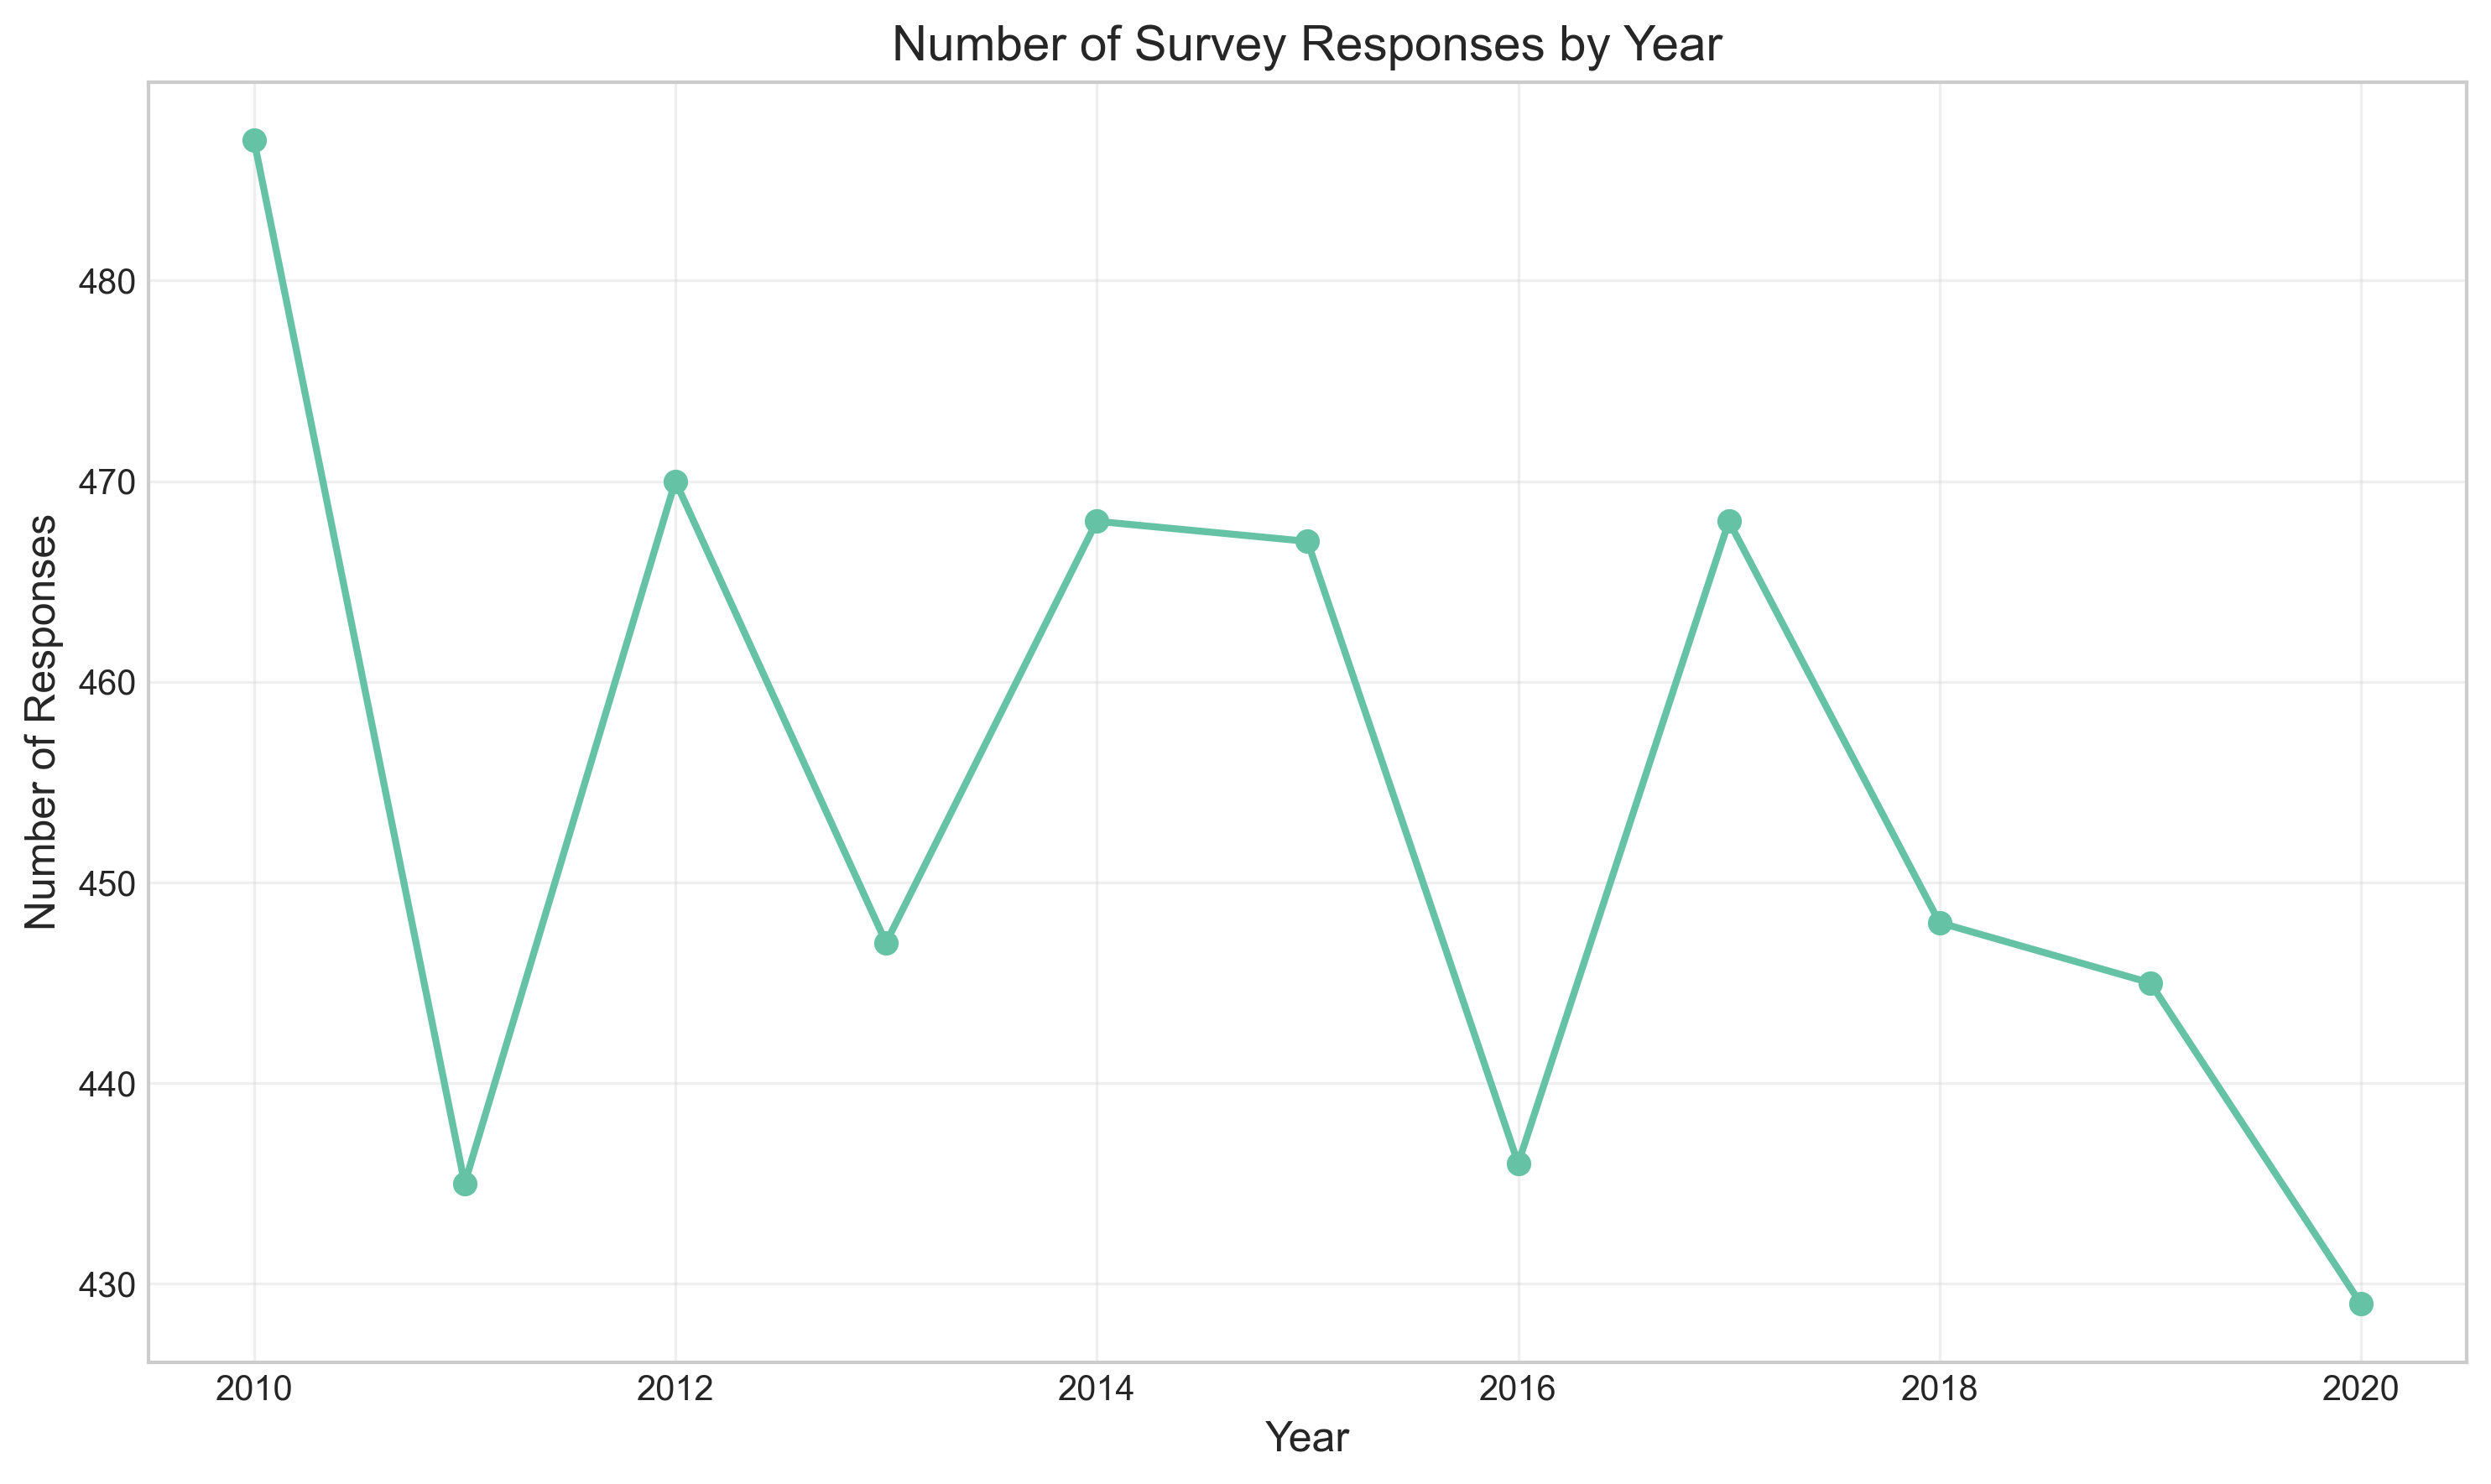
Number of survey responses by year
Step 4: Run advanced statistical analysis
Need deeper insights? PlotsALot makes complex statistical analysis simple:
"Run a regression analysis to identify which demographic factors (age, education, income) most strongly predict political views in the GSS data"
The AI delivers a complete regression analysis with coefficients, p-values, and a plain-language interpretation of what the results mean.
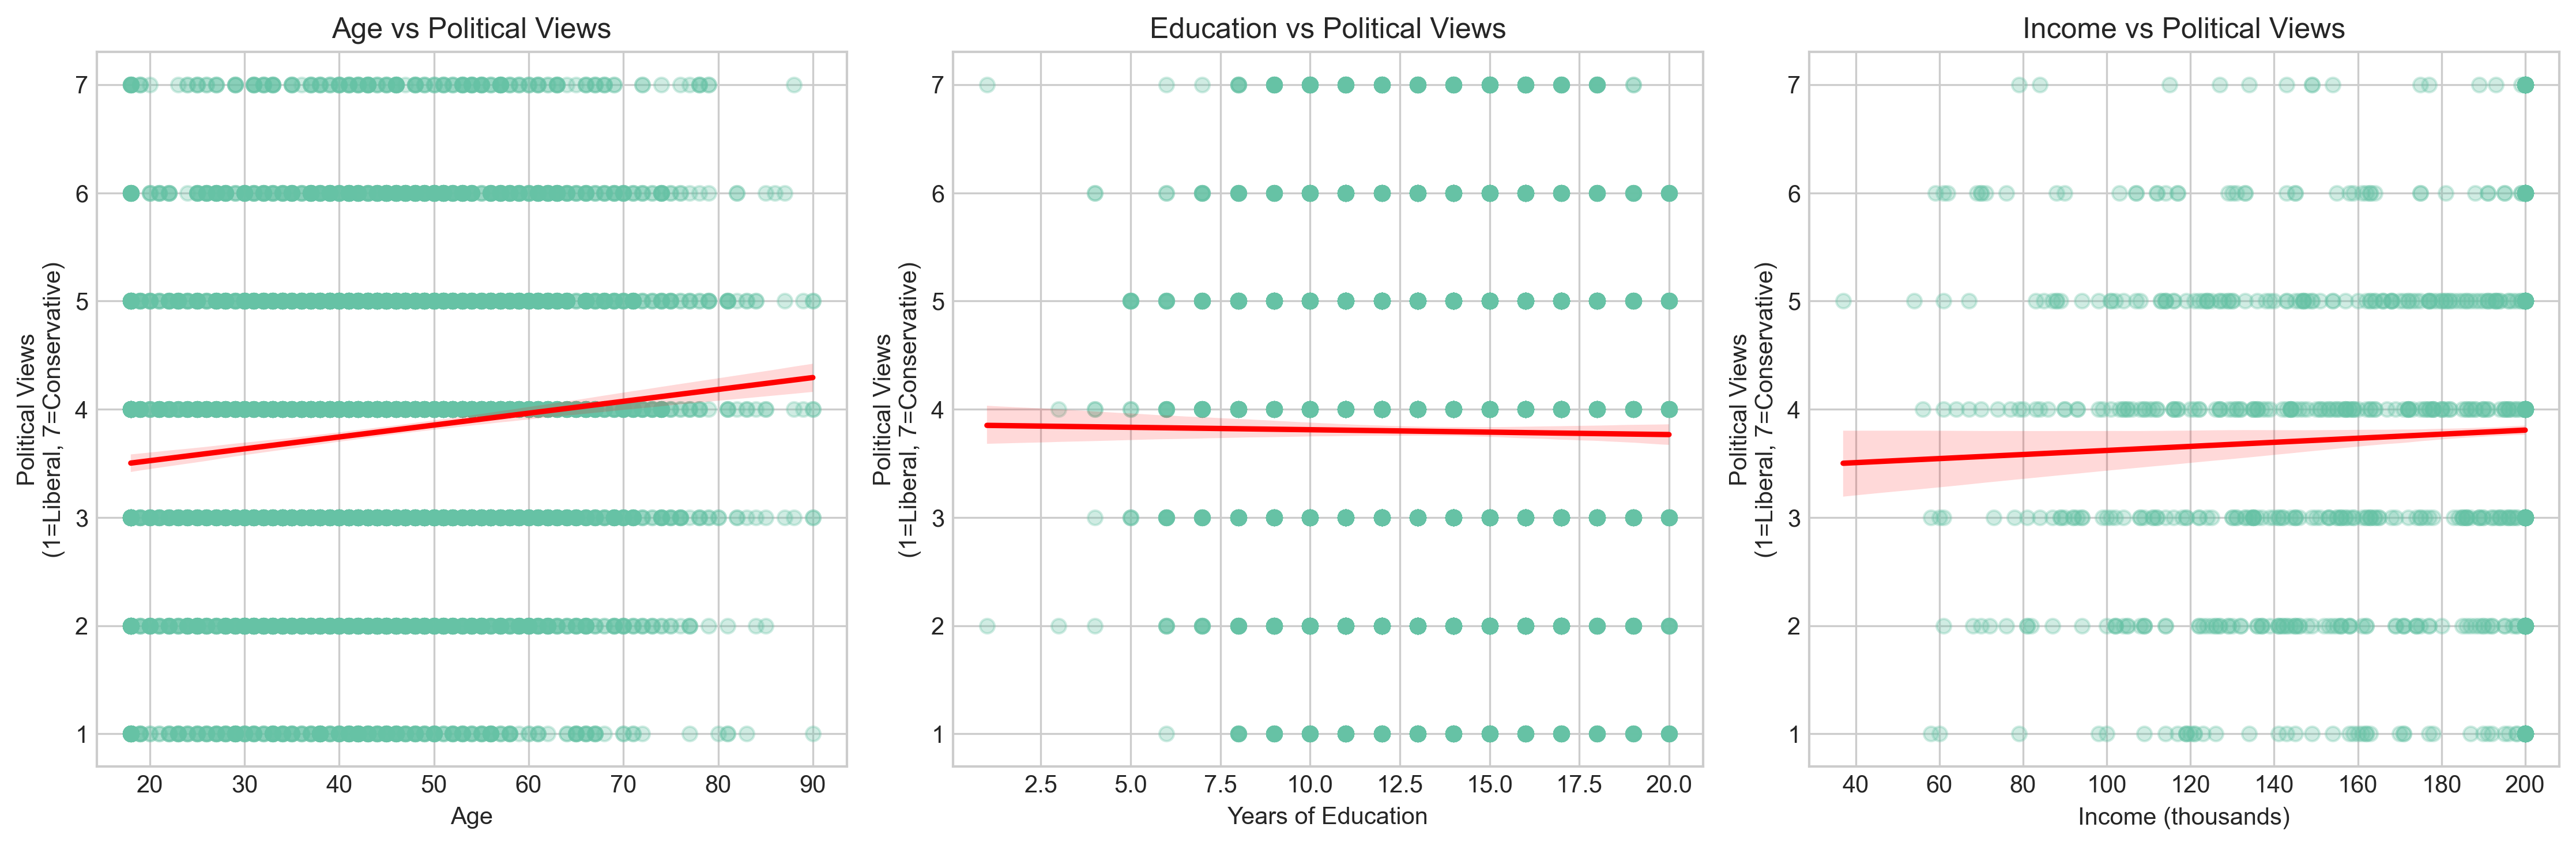
Political views factors analysis
Conclusion
PlotsALot eliminates technical barriers for sociologists. Upload your data, ask questions in plain language, and get actionable insights immediately. No need for complex software setups or coding expertise.
Whether you're tracking social trends, analyzing survey responses, or testing sociological theories, PlotsALot helps you focus on what matters - deriving meaningful insights from your data.
See Your Data in Action
Ready to visualize your own data? Try our AI-powered analysis tool and transform your data into beautiful insights.